

Get Your Stats Right: November 2024
Rounding up the last month's numbers for United

Welcome to the November edition of Get Your Stats Right! The October issue was published on the back of 3 wins in a row, 9 from 9… Since then, there have been 4 league games, 3 draws and another match that probably happened. We also had an FA Cup Round 1 win before a Round 2 loss in extra time vs Wigan and an EFL Trophy win.

State Of the Team
If this was the September issue, we’d take those 3 points from 4 games because that was better than most stretches before United’s 3 (and so far, only) wins in a row. Now, after 3 wins in a row to end October, 3 points from 4 seems poor.
12 points from 7 games is 78-point season form. That’s promotion playoff-form for virtually all League One seasons except 21/22. I’ve certainly been going through waves of hype over the past couple months, inconsistent much like the team.
But the signs are there, that United can string together some decent stretches of points (just 1 loss in 7 straight league games (although it was a humbling one)) and likely give some elation at the end of the season.
The issue might be that our early season form was so dismal that it’ll likely come on the final day of the season. Which is thankfully at the Abbey. But against Birmingham City.
Note: I’m writing this before kickoff against Reading later today. At the time of writing, United are in 22nd, 3 points from being just out of the relegation zone on goal difference. I’m confident the players and Monk have what it takes to stay up, but only if we end on one of these decent runs of form.
What’s Up?
We’ve seen how the club is able to perform well, or even just not lose games, for different stretches of time. 3 wins in a row, a massive loss, 3 draws in a row… We can’t expect this form until the end of the season, but what could we expect?
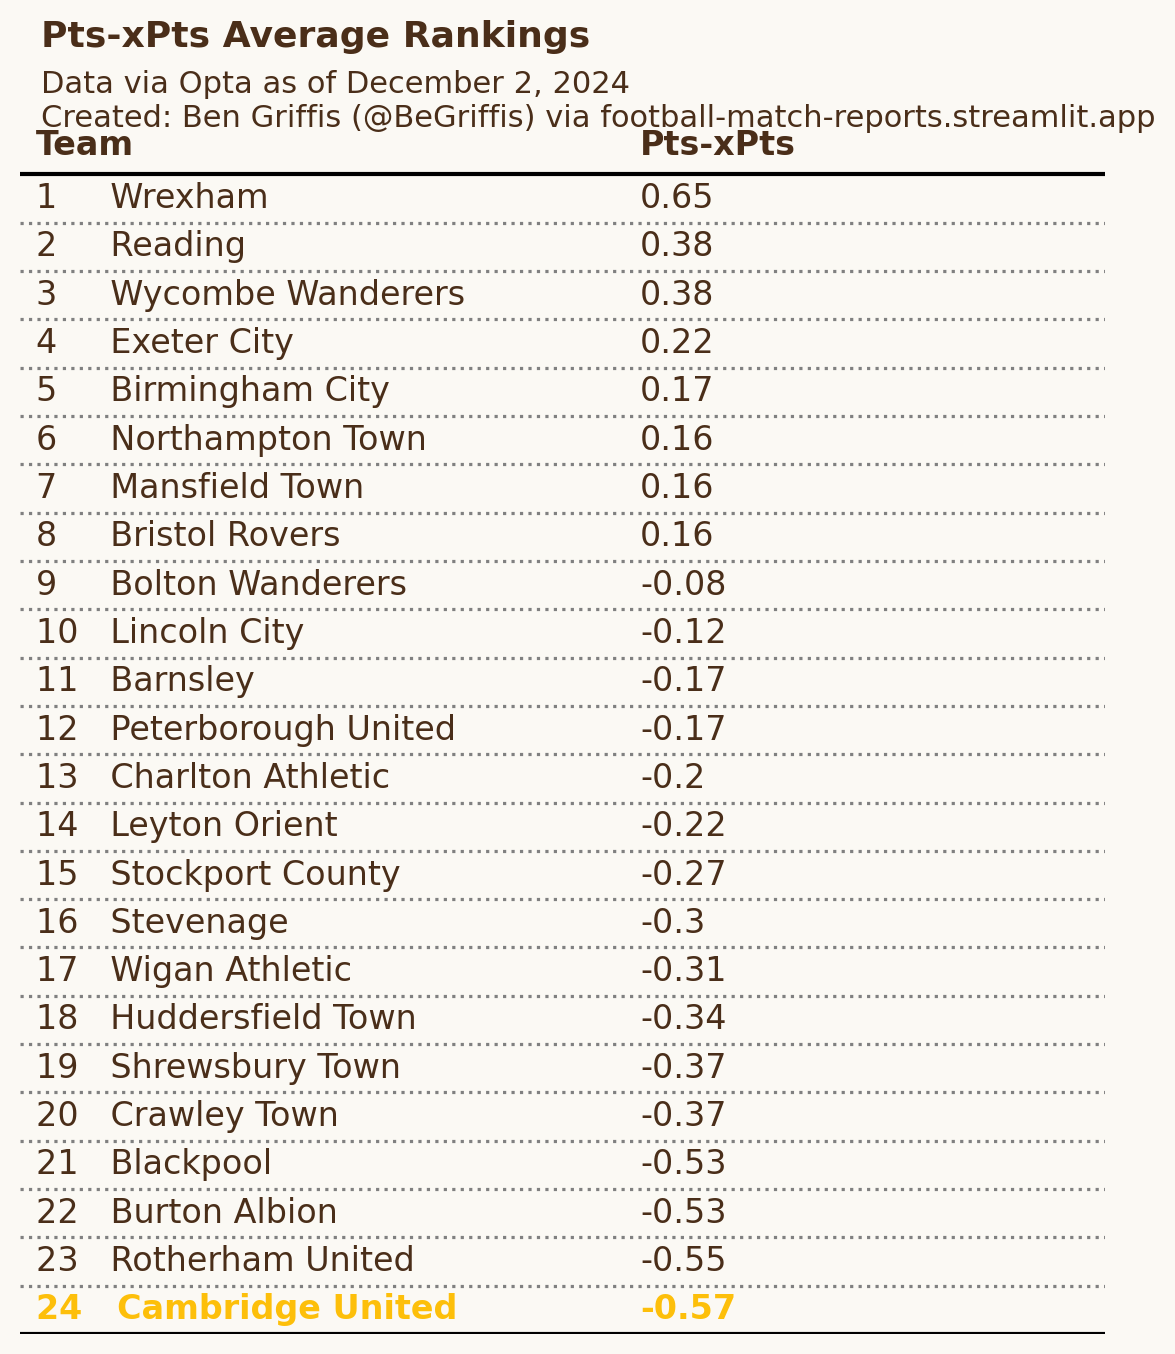
Sadly, we are the worst in the league at getting the results we may “deserve”. An average of 0.57 fewer points per game than expected. Which, thankfully, does imply that the “underlying numbers” continue to be decent as I’ve written about each month, but we just aren’t putting games to bed properly.
The issue, however, is that we have been consistently under-performing our expected points after 16 games. While virtually every individual game will be slightly more or fewer points than expected (you can’t earn 1.22 points, a draw off 1.22 xPoints would show as a -0.22 Pts-xPts), we can see how a lot of draws “should have” been a win, or losses a draw.

As I’ve mentioned before, though… I am of the opinion that consistently under-performing is better than being inconsistent. It means there is something for the coaching staff to diagnose. I personally think the U’s have one major issue: a leaky defense.
Leaky Defense
Opta Analyst has a pretty good xG model. Much better than mine in terms of exact numbers (relative rankings are similar enough). Opta’s model has expected United to concede 18.29 goals, and we’ve conceded 25. That’s 6.71 more than expected, the 3rd-worst in the league. Only Blackpool and Bolton are worse in this area. The image below shows the 10 worst teams’ data.
The saving grace is that we seem relatively consistent in allowing more goals than expected. I’d rather have this than inconsistency, again because that should make it easier to address the root cause and look for a solution. But of course, the cause has to be identified and/or the solution needs to be implemented.
And as an American, sadly, I think the root cause is our resident American-Chilean goalkeeper Vicente Reyes.
The Goalkeeper Problem
Reyes is the 2nd-worst keeper so far in terms of total “prevented goals”. This metric looks at Expected Goals on Target (xGoT), which is similar to xG but only looks at shots on target. Instead of the location of the shooter when a shot is taken, it looks at the location of the goalkeeper in the goal, the velocity of the shot, the spin rate, the placement of the shot on the goal, and more. It’s actually a much better estimation of how many goals a team should score than classic xG.
Prevented goals, then, is the xGoT minus Goals Conceded. A goalkeeper who faces 10 xGoT and concedes 9 goals would have a prevented goals number of +1.0. Opta’s per 90’ number for Reyes is -0.3, Wyscout has -0.2, and FotMob has -0.36. Regardless, he ranks as one of the worst shot-stoppers in the league so far. Here’s his data profile from my app.
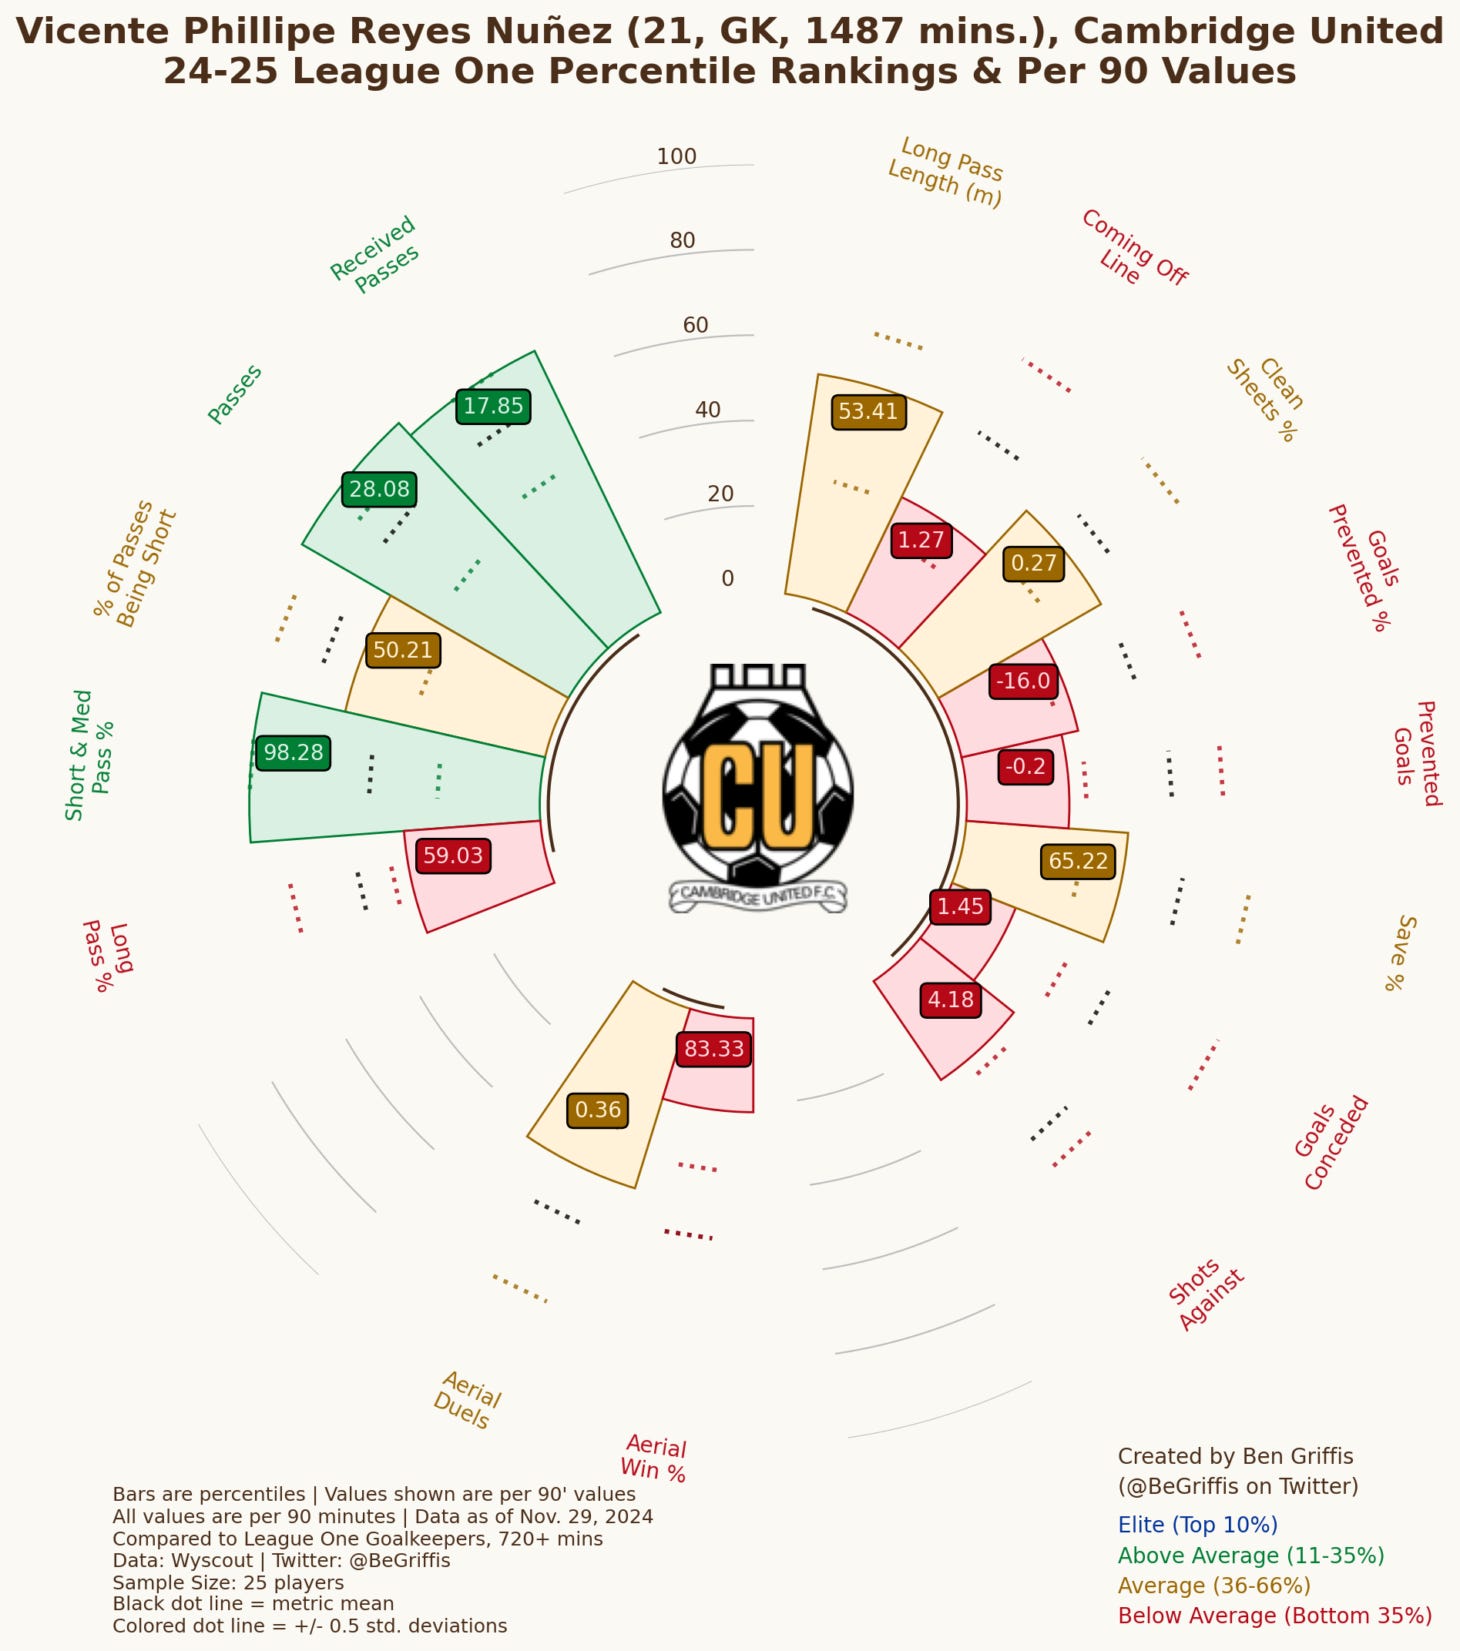
While the team is leaky to begin with and concedes a lot of chances, Reyes preventing a lot fewer goals than expected exacerbates these issues. Two main ways to concede fewer goals in this situation are either to shore up the defense and allow the opponent fewer chances, or to have the goalkeeper stop more of the shots that do come currently.

A Perfect Comparison Illustration: Rotherham
Obviously, it’s not always simple to just replace the goalkeeper, just as it’s not simple to just allow fewer chances. But compare Reyes’ shot stopping numbers to fellow stragglers Rotherham United’s Cameron Dawson.
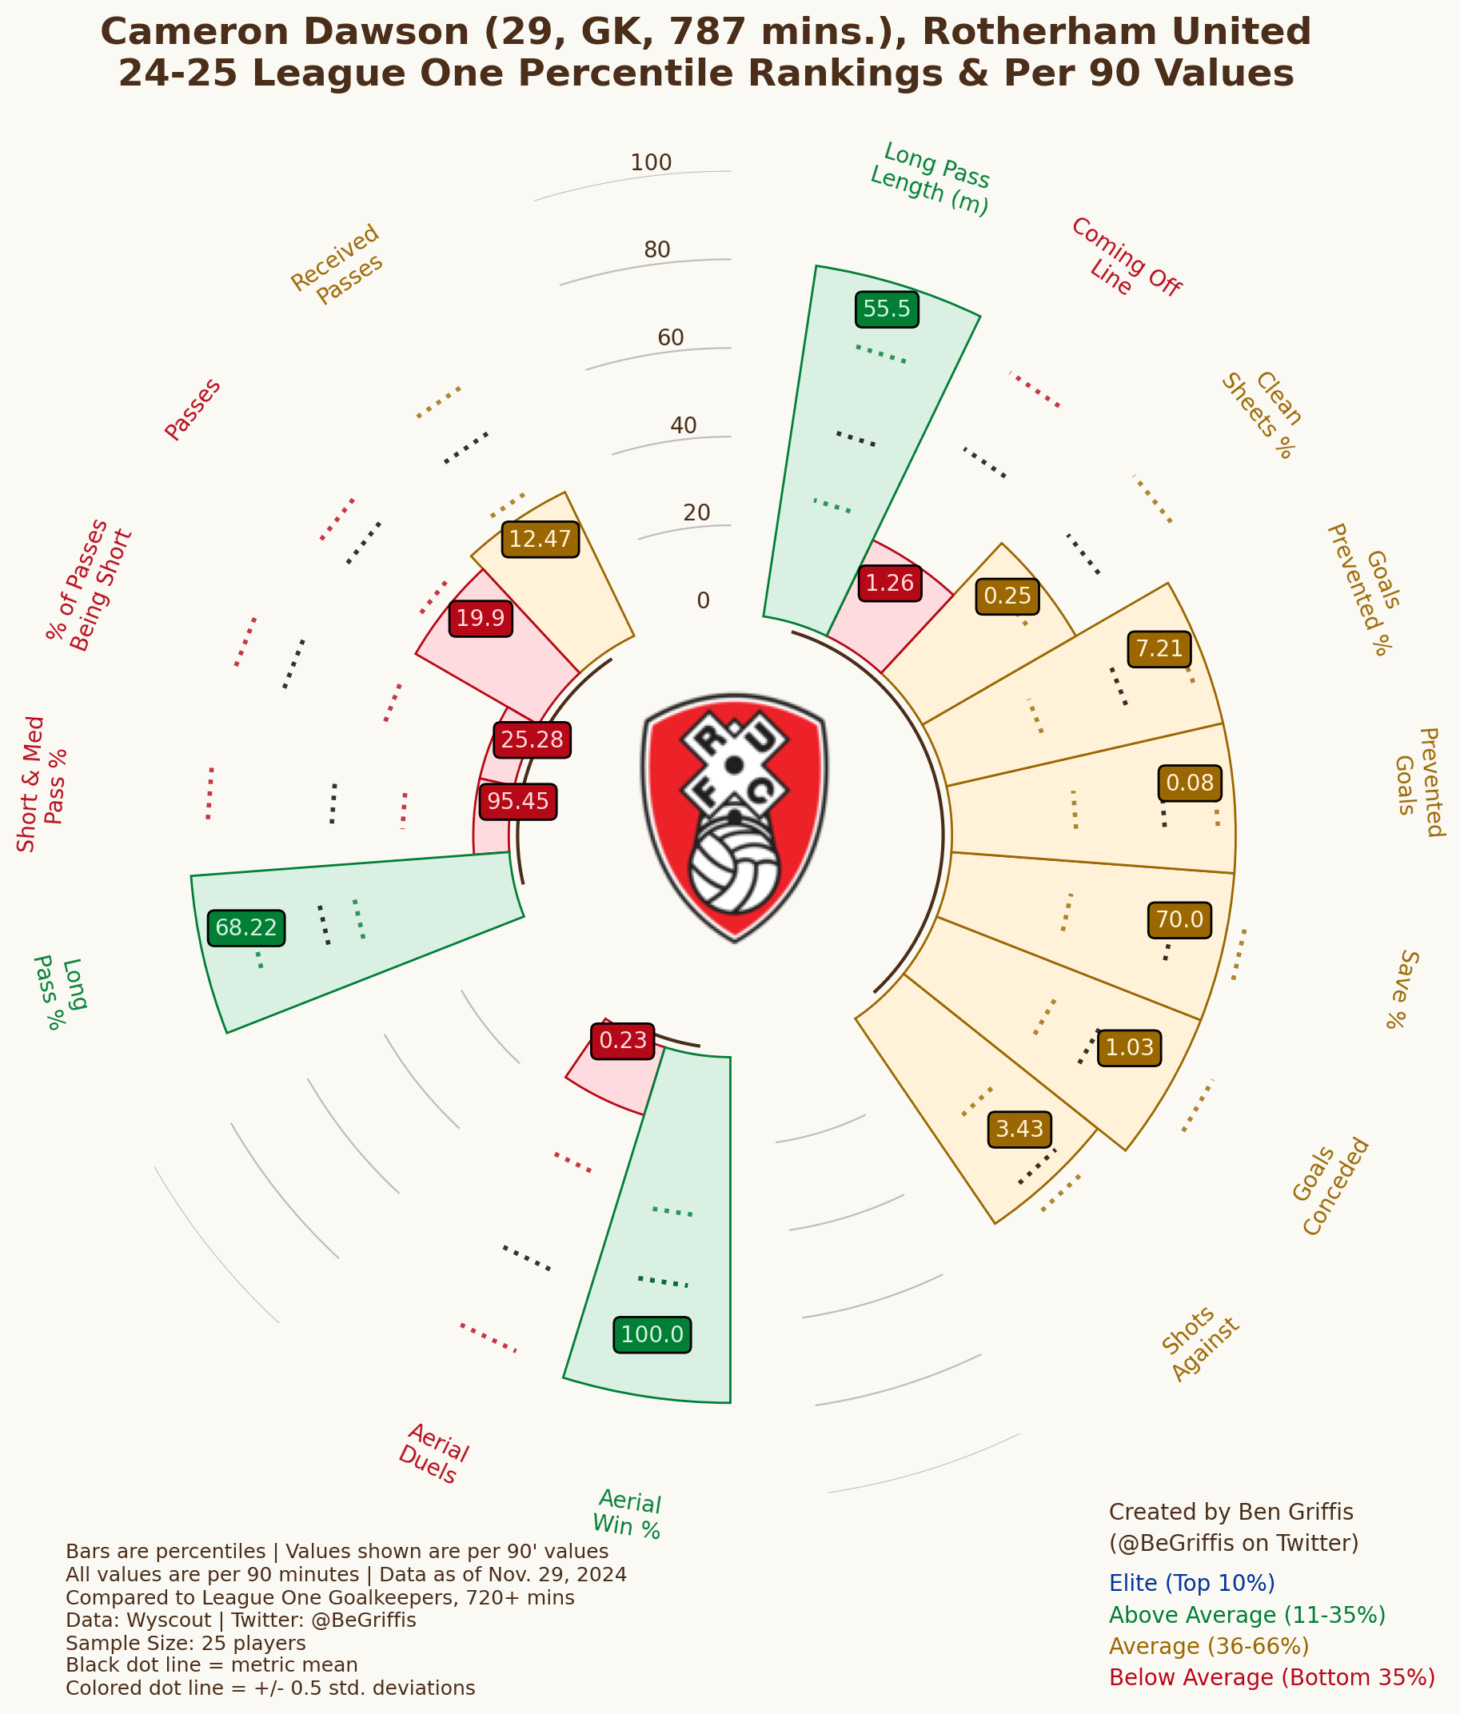
Dawson is effectively conceding as many goals as expected. And, luckily from a data and comparison perspective, Dawson has split time with fellow keeper Dillon Phillips, with each player playing 8 games so far. Phillips the first 7, Dawson the next 8, and then Phillips (who is also about to start his 9th, vs Lincoln City at time of writing).
Take a look at Phillips’ data:

Phillips is closer to Reyes’ shot-stopping ability, conceding about 0.14 more per 90’ than expected. They also both face about the same number of shots per game, 3.43 for Dawson and 3.57 for Phillips. This offers us a weirdly amazing sample to compare these two keepers’ results and also illustrate why United have been poor.
Phillips, the worse shot-stopper, has a 1-3-4 record conceding 10 goals. That’s 6 points from 8 games, or 0.75 per game.
Dawson, the better shot-stopper, has a 3-2-3 record conceding 9 goals. That’s 11 points from 8 games, or 1.375 per game.
1.375 is 83% larger than 0.75. It’s not a given that signing an average shot stopper like Dawson would give United 83% more points, but it would likely guarantee more points, especially with FIVE 1-goal losses and 4 draws. That’s 9 games, and possibly 3 to 5 points.
I don’t want to sound like I’m putting massive blame on a single player, but simply using Reyes’ data to illustrate what having a poor shot stopper vs league average does to a team who allows the opponent to take a lot of shots. It can overwhelm goalkeepers, and leads to lots of points left on the table.
With January coming up, I’d call for the club to look for a goalkeeper to challenge Reyes for the starting spot. Ignore what they can offer with the ball at their feet, and look at how they stop shots. Look at how they respond to facing 4, 5, 6 shots on target per game. Reyes is above average with the ball at his feet, so let’s look for an improvement on his shot-stopping to not only challenge him to develop further, but to offer Monk options each game. Do we want to try to use the goalkeeper more in possession to counter a positional defending team? Play Reyes. Are we expecting to be peppered with shots? Play the new bloke.
Where Is the Defence Leaky?
It’s great to say the defence is leaky, but can we find out where the major problems lie? Or is it everywhere?
I think the biggest area to improve upon is down United’s left flank. The image below shows all the passes we’ve conceded into the box this season.

Overall, 290 passes into our box have come from the left third of the pitch, and 225 from the right. 110 from the central third. Put differently, 46.4% of opponent entries into our box via pass have come from the left, and 36.0% from the right.
Below is a different take on the same concept. Instead of just passes into the box, I have a “relative strength” model that scores actions within a 24x14 grid across the pitch, trying to see where a team’s strong and weak points are in defence. This is not compared to any other teams in the league, but just relative to Cambridge United.

I include a lot more than just passes, for example I include opponent passes into the box, with context if they are crosses or not, and if they are completed or not; shots faced, with context if they are inside or outside the box as well as blocked or not and headed or not; fouls made; and other defensive actions such as tackles, interceptions, and ball recoveries.
This all creates a relative score in each section of the grid, which I then turn into a color-coded “elevation” plot. The blue, low-elevation areas are our weak points, and the red, high-elevation areas are where we are strongest. And again, this strength is relative to United’s average strength not the league average.
This plot may be a better illustration of our relatively weak left flank than just the pass plot, since it also shows that we might not be recovering the ball as much as we should on the left compared to the right. This plot also tells us that we’re relatively strong right on the border of our defensive third and the middle third, and pretty consistent in terms of defensive quality in most areas of our half outside of the left flank.
Danny Andrew and James Brophy are the main defenders of the left flank. Jubril Okedina and Liam Bennett are the main defenders of the right. What this tells me is that either the spacing between Andrew and Brophy, or the communication, or the quality of defensive actions is lacking. And these are relatively better between Okedina and Bennett. It could also be the spacing between Andrew and the central centre back (more often Michael Morrison of late) in each game as well, with poor coverage in that area from one of the central midfielders or defensive midfielder, whatever the formation is in a game.
Because Brophy has more of a tendency to push higher or narrow than Bennett on the opposite flank, it’s possible that there is just too much space for opponents to exploit here. Subtle tweaks to the system, such as Brophy having a little less freedom or maybe playing with two defensive midfielders more consistently, rather than just Cousins as we’ve seen a little more recently, could help out a little bit. But that could also potentially lower our threat going forward if we have fewer bodies attacking the box. The calculus of tactical tradeoffs is what makes analyzing so fun and frustrating!
Now, since we’ve been using Rotherham as a comparison so far, let’s just take a very quick look at their chart.

They have defensive holes on both sides of the box, but perhaps more consistent quality outside of those areas because there’s a lot more territory “at sea level” i.e. a whitish hue, not red or blue.
Which, given the similar defensive holes down the left, might further drive home the illustration between a below-average shot-stopper and an average one.
What Does This Mean?
The solutions to issues like ours are complex. Even the diagnoses can be more complex than what I’ve done in this article. There’s no guarantee that replacing Reyes with a better shot-stopper leads to more points. Or that locking down the left flank (and the defense in general) has the same effect.
But hopefully this article can shed some light on what I’ve found in the data as two of my biggest concerns. Defensively, at least! The left flank is definitely an issue, and thankfully one that can be addressed immediately on the training ground. That’s the key area I’d focus on short-term if I were Monk, while asking the club’s recruitment staff to see if there are any goalkeepers that could be brought in to challenge Reyes in January.
As I said at the beginning of this article… I still think Cambridge United can beat the drop. There is a foundation that shines through, but sadly, what’s built on top of it can falter and collapse any given game. However, it appears as though the issues are not only able to be seen, but able to be addressed. That’s what helps give me hope that despite the terrible form of the first 9 games, we can still avoid the drop and have some good periods of form doing so.
 | A guest post by
|