

Get Your Stats Right: February 2025
A look at some managerial data and why Neil Harris might just pull this off...

I just looked over January’s GYSR issue, and the piece opened in this little intro by lamenting an uneventful January. Well we’ve certainly made up for that haven’t we. Ben G is here to look over some managerial data, why Harris is an excellent appointment, and try to give us hope that a fist-pumping Chopper might just do the unthinkable.
In a shocking twist of fate, BOTH of our two previous permanent managers have come back to the Abbey after Garry Monk was let go. Mark Bonner as Director of Football and Neil Harris as manager. Bonner’s return is likely to be welcomed by every fan, but Harris’ last stint left a few fans with a sour taste in their mouth that’s hard to cleanse.

However, we simply cannot ignore the fact that Neil Harris is a manager who might be too good for a club in deep League One relegation trouble. Did he leave us rather abruptly after just 77 days last year? Yes. Is he a really good manager? Also, yes. And that’s what United need right now.
And what better way to illustrate the impact he had for a few weeks last season, and thus should have again this season, than with cold hard data? The 23/24 season is a great way to compare not just Monk and Harris, but also Bonner.
Bonner was in charge for 19 games, Harris 13, and Monk 11. They didn’t all play the same teams so it’s not an “optimal” sample, but there are at least 10 games of data for each of them, which is a much-used round number threshold for football analysis.
Points Per Game
Mark Bonner oversaw a 5-5-9 record, 20 points or 1.05 per game. Naturally, this wasn’t good enough and a change was needed.
Neil Harris had a 5-3-5 record, 18 points from 13 games or 1.38 per game. In his first 5 league games, we averaged 1.4 PPG. Bonner’s last 5 games were 0.8 PPG. That’s a huge swing in the positive direction in a short time.
Garry Monk then had a 2-4-5 record for 10 points or 0.91 per game. That’s worse than Bonner. Monk’s first 5 games were also an average of 1.4, the issue was the final 6 games of the season he went 0-3-3 for 0.5 PPG.
After taking over Millwall in the Championship for the end of 23/24, Harris led them to an 8-2-3 record, 26 points from 13 games or 2 PPG. He was a little worse this season, a 6-7-7 record for 25 points or 1.25 PPG. That’s still a solid points haul especially for a manager coming down to try to save a floundering Cambridge United. In fact, across Harris’ 203 Championship games as a manager, he’s averaged 1.34 points per game.
Monk has managed 1.39 PPG across 177 Championship games, although Monk’s managerial trajectory has been on the steady decline ever since it began.
Let’s look at bit deeper into their career trajectories…

Monk’s Career Trajectory

Monk took over Swansea in the Premier League for the end of the 13/14 season, going on to have a solid 1.47 PPG and 8th place finish in 14/15 before having 0.93 PPG over the first 15 games of 15/16 and being sacked. He dropped to Leeds United and took them to a 7th place finish in 16/17, 1.63 PPG but it’s been downhill since. 1.5 PPG in 17/18 with Middlesbrough and Birmingham, then 1.33 PPG with Birmingham in 18/19, finishing 17th. Then 1.18 PPG with Sheffield Wednesday in 19/20 before being sacked early in the 20/21 season after managing 12 points from 11, or 1.09 per game. Finally, he managed 0.91 with us at the end of 23/24 and just 0.74 across his 31 matches in 24/25.
That’s a pretty eye-opening path, to be brutally honest. Monk does have Premier League pedigree, sure, but he seems to have performed worse at each job he’s had since. That’s not a good sign, and I’d bet his next job is in another relegation-level League One team or an upper-table League Two side. If he can succeed at that level, perhaps he can climb up the managerial ladder again. I wish him all the best, but it does seem like his time at United was prolonged in the end.
Harris’s Career Trajectory

Compare Monk’s staircase-to-the-basement trajectory with Neil Harris. Harris took over Millwall at the end of 14/15 in the Championship, unable to save them from relegation despite a respectable 1 PPG. He finished 4th in League One in 15/16, with 1.76 PPG, losing 3-1 to Barnsley in the Playoff Final. He got the job done the next season, finishing 6th with 1.59 PPG, slightly worse off but still successful. Millwall finished their first season back in the Championship with 1.57 PPG, landing them 8th, although the next season in 18/19 was pretty poor, finishing 21st with just 0.96 PPG. He left the club next season after just 10 games but had improved to 1.1 PPG. He took over Cardiff and led them to 5th with 1.73 PPG, losing in the Playoff Semi-Finals to Fulham. Cardiff sacked him halfway through 20/21 after 1.21 PPG and being mid-table.
Harris then dropped to Gillingham for the last third of 21/22, but despite a very strong start, couldn’t save them, being relegated on goal difference. He ended the campaign with 1.17 PPG. He finished 17th in his first-ever League Two season, 1.2 PPG, but improved a lot in the first bit of 23/24 before being sacked. He had 1.73 PPG in those 11 games before coming to United and securing 1.38 PPG with us. And after leaving us, he managed 1.73 PPG with Millwall in the Championship to end 23/24 and then had 1.25 PPG in his 20 games with them this season.
Neil Harris’ trajectory includes periods of both decline and improvement. And as we’ve seen already, in the short time he was in charge of the U’s last year, he made an instant impact. I think we might be able to be hopeful for that again this season. If he pulls off a great escape (which is unlikely but not impossible), he could potentially lead us to mid-table performances next year. And if he can’t pull a rabbit out of a hat, he’s shown ability to finish in playoff spots with newly relegated sides 2 out of 3 times in his career (Millwall 15/16, Cardiff 19/20). That’s a decent hit rate even if his 22/23 Gillingham campaign negatively stands out as the third time taking over a newly-relegated side.
Underlying Performance Data & Style
Enough words, let’s get to some more data, shall we? Using Wyscout data, we can create performance/style data profiles for each manager’s teams, much like I’ve done for players in the last couple GYSR editions.
The profiles you’re about to see only include games played in the league during the time each manager was in charge. So, for Harris’s 23/24 Cambridge United profile for example, that’s all League One games between December 6th, 2023 and February 21st, 2024. So, each manager’s percentile rankings are compared to what other teams did in that timeframe, instead of what they did for the full season.
First off, let’s see Mark Bonner’s data profile for 23/24.

In general, these metrics on the image are separated into attacking metrics on the top left, defending metrics on the top right, and general possession style on the bottom. Blue and Green represent elite and above-average numbers respectively (compared to the rest of the league), yellow/gold represents average numbers, and red indicates poor numbers.
Not impressive at all for Bonner. It was a sad ending but he was rightfully sacked, even if the first few games of the season were incredible results-wise. Bonner’s United had 46.5% possession, generated 1.04 non-penalty xG (npxG) per 90 minutes and allowed 1.40 npxG per 90’. We ranked very low at getting the ball into the final third and penalty box and, importantly, very poor at our attacking efficiency (both positional and on the counter). This “efficiency” is the percentage of attacks that include at least one shot.
Now let’s see what Neil Harris’s data profile looked like taking over a below-average team.

It’s night and day to Bonner’s numbers. Similar possession numbers (45%), so we can broadly compare our npxG and npxG faced… Harris improved our npxG to 1.31 per 90’, and our npxG faced to just 1.03 per 90’. That’s a swing in non-penalty expected goal difference (xGD) from -0.35 per 90’ under Bonner to +0.28 per 90’ under Harris in 77 days. Huge improvement.
Under Bonner just 19.3% of our counters included a shot, but under Harris that number shot up to 42.9%. Positional attacks (i.e. “regular” open-play attacks) saw shots 22.7% of the time, which was the same as under Bonner although the rest of the league must have been worse during this timeframe because Harris’s 22.7 figure ranked as a higher percentile than Bonner’s.
Now, let’s compare Garry Monk’s data profile to end 23/24.

We see a general reversion to the average/below-average numbers that Bonner had. A few key areas under Monk were very solid, such as our average shot distance being relatively close to the goal (which naturally leads to a high average npxG per shot). But overall, these are pretty poor numbers.
Our counterattacking efficiency decreased again, to 20.5%, and positional attack efficiency ranked the worst in the league under Monk at just 16.2%. This has been a constant issue for me with Monk’s tactics at the club, as I’ve written in the early-season GYSR articles about how the buildup was solid but he couldn’t turn those buildups into attacks, let alone good attacks.
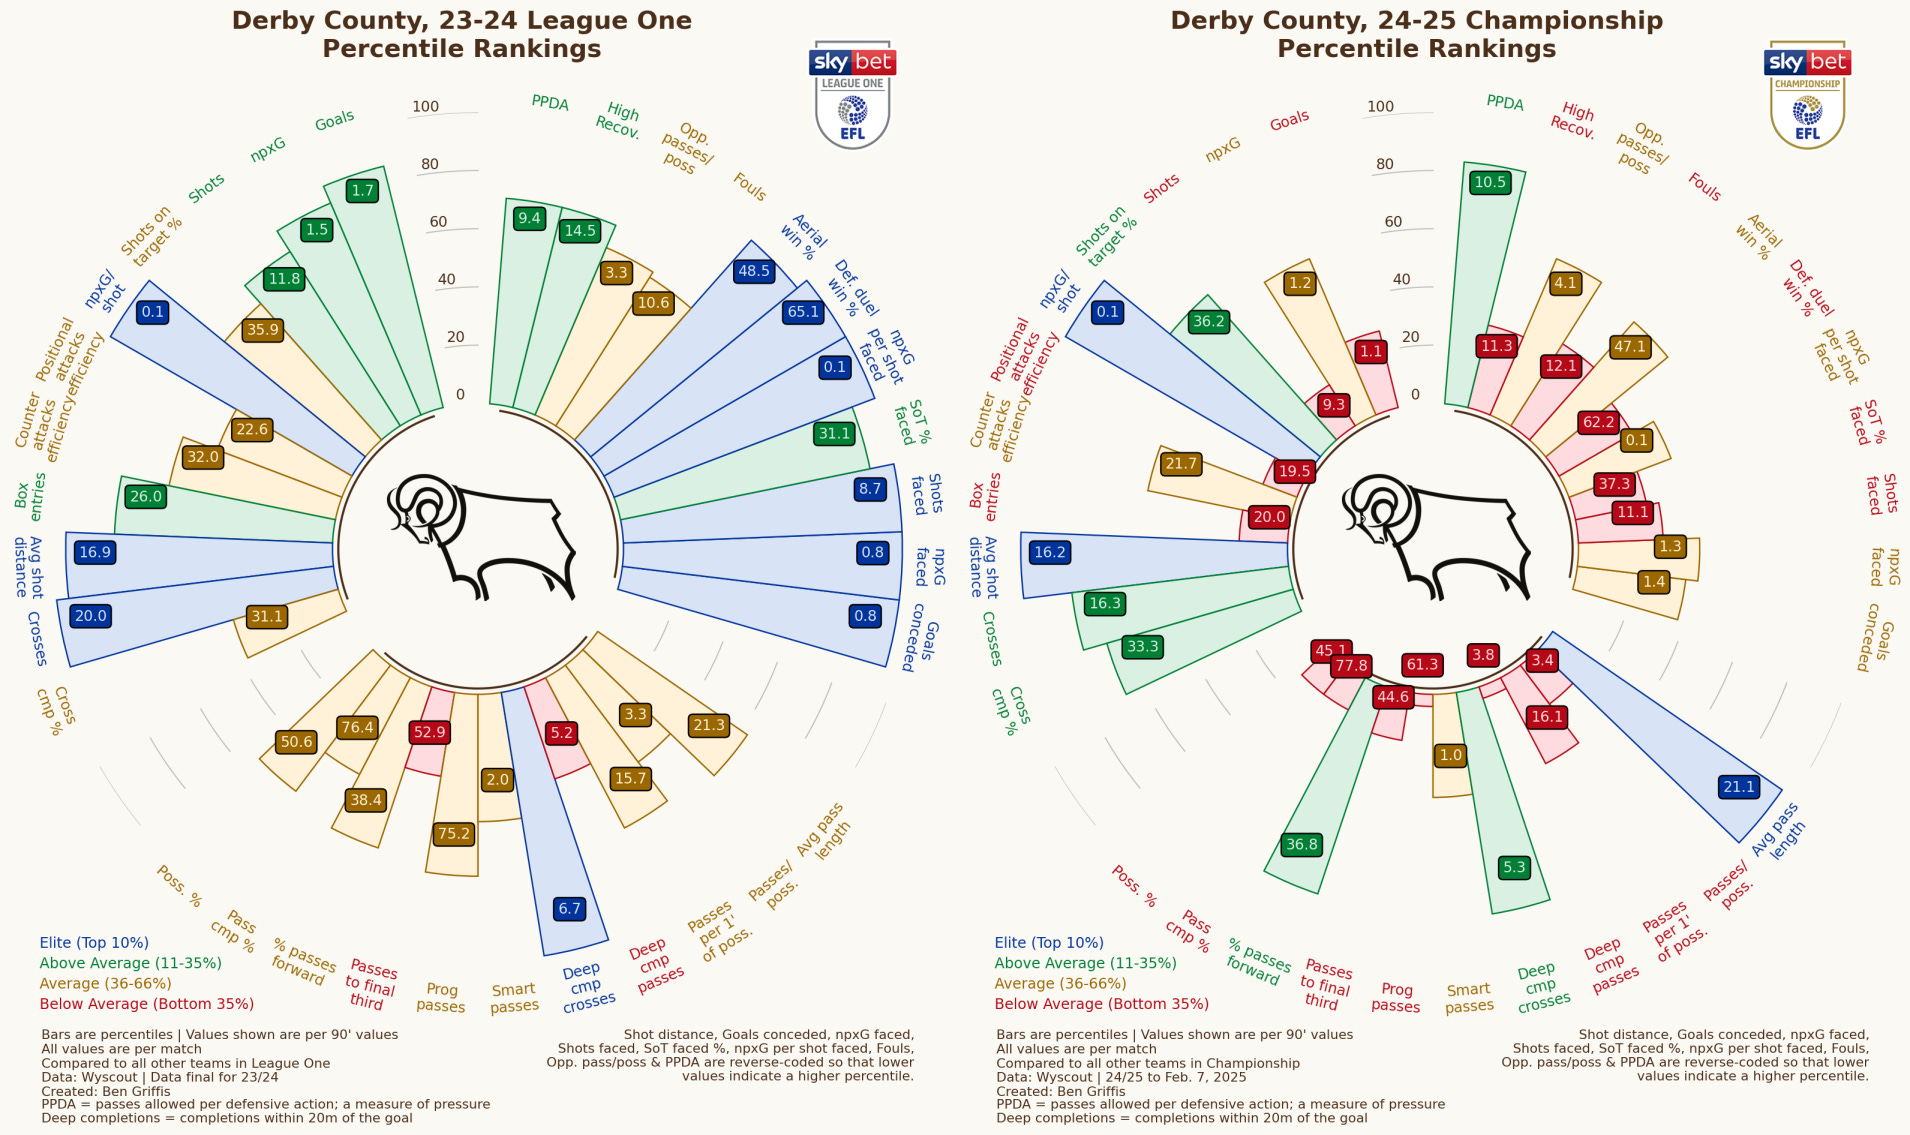
The major swing from a poor United side under Bonner to a good one under Harris and then back to a poor side under Monk across 23/24 is telling about Neil Harris’s ability as a manager. Below is Garry Monk’s data profile for this season, and it’s very similar to his 23/24 performances albeit a little more npxG per 90’ but quite a bit worse across the board defensively.

Neil Harris made an instant impact last season and United were arguably performing worse (in the underlying numbers) when he took over from Bonner than now when he’s taking over from Monk, although this time he’s taking over when the club is in a much more precarious position in the table.
Is Safety Possible?
The biggest question on our minds is naturally, can Neil Harris save us from the drop? It’s going to be very difficult, but I don’t think it’s completely out of the question. We are currently 7 points from safety with 15 games remaining. We’ve been pretty poor to date, but it’s still possible to remain in League One if Harris can improve us similarly to how he did last year.
Below is a very quick, very rough image showing two theoretical worlds where we finish 20th.

In this first scenario, Harris finishes the season with 1.3 points per game. This is 75% improvement on our current form, but it’s not totally out of the question since Harris brought us to 1.38 PPG form last year. Given that we’re a little worse this season, a more conservative 1.3 PPG could be likely.
In this scenario, the “simplest” route to safety would occur if both Peterborough and Crawley decline in form compared to what they’ve put up so far this season. If Posh move from 1.0 PPG form to finish the season on 0.7 PPG form while Crawley decline from 0.94 to 0.84, we’d be safe.
Obviously, the odds of only 3 of 24 teams finishing the season with a different PPG record than they have at the moment are infinitesimally small. But the idea here is to show us that if Harris can bring us to around 1.3 PPG as he did last season (over 13 games, while there’s 15 remaining this season, so a similar number of games), we could reach safety with a little help from our friends up the road.
But what’s the level we need to hit to save ourselves, if theoretically every other team kept on their same form?
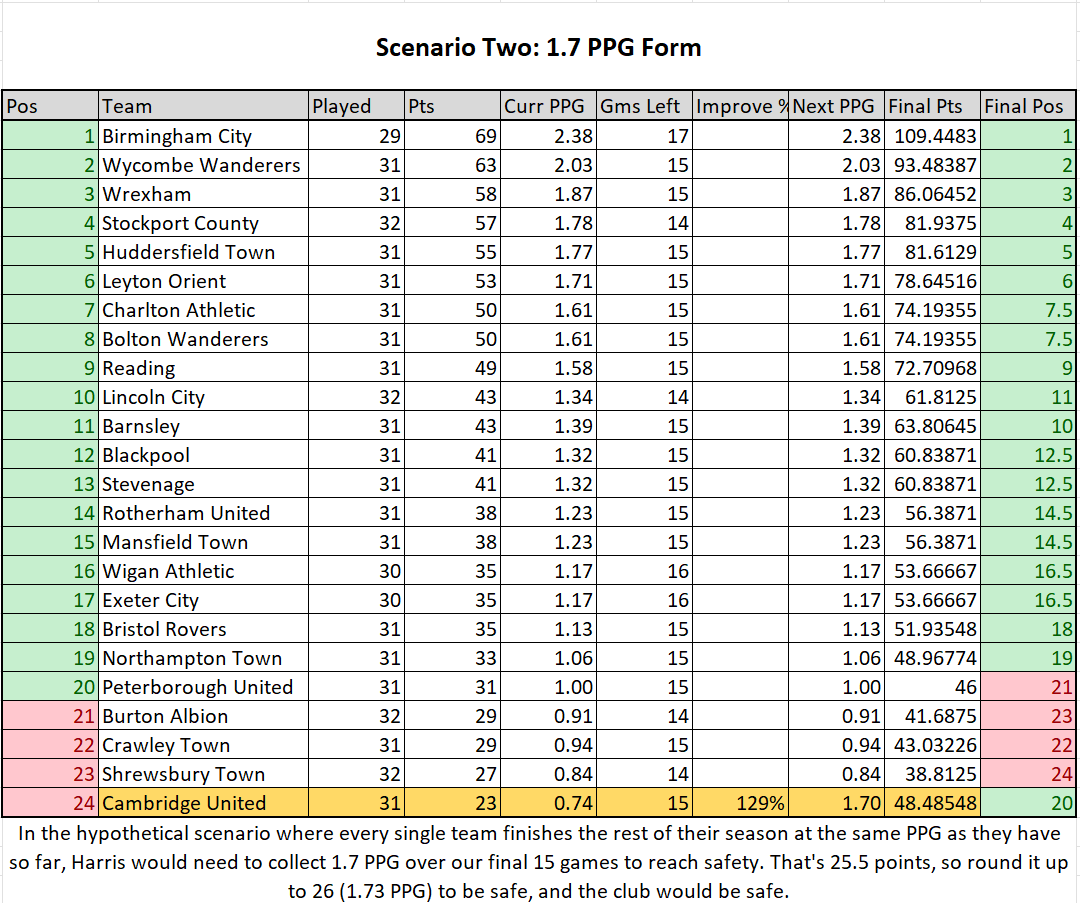
1.7 points per game. That’s a tall order, so is probably not possible, but it’s a good number to have in mind. The further our form is from 1.7 PPG under Harris, the more help we need from other teams.
There’s so many scenarios with most teams having 14, 15, or 16 games left to play that it’s impossible to quantify a specific points number that we’d need to earn safety. But it’s a positive that we might be able to remain in League One if Harris does the same job as he did last season, and we get help from other teams.
Here’s a quick, not-very-thought-out schedule of our results that would give us 20 points, or 1.33 points per game.

Since I wrote this last week, we’ve already secured the first win against Stockport which I didn’t predict on the table above. I haven’t done any deep analysis on underlying numbers to see which of these results is more or less likely. But a 5-5-5 record isn’t too far out of the question even if it’s difficult to achieve, and the first of those wins is in the bag already.
Key results in here are Crawley away (relegation rivals, they’re on about 1 PPG form, a victory would be immense), beating Posh at home, winning away at Shrewsbury and Burton Albion (switch one of those for a win over Leyton Orient, Blackpool, or Welshpool)… and beating a very beachy Birmingham City at the Abbey on the final matchday to likely secure safety. At this point, Birmingham may have already secured promotion if not the title, so they could be on holiday already coming up against a team who could secure safety with a win. I’d try to fly in for that game for the vibes!
For comparison, a 7-5-3 record would get us 26 points or 1.73 PPG, which would (in theory) be the threshold we’d need to secure safety without help. But that’s almost certainly out of the question as we play 4 of the current top 5 teams and 6 of the top 7.
We do, however, play all 5 teams sitting above us currently and they’re spread out quite nicely. Crawley is Harris’ 2nd game, Peterborough 6th, Northampton 8th, Shrewsbury 10th, and Burton 14th. Only Peterborough and Northampton are at home, however.
The club is in a very difficult situation at the moment, but there is still some hope for us. Neil Harris is a good manager who has proven, even at Cambridge United, that he can come into a team and get immediate results. Maybe he’s our Big Sam. Maybe he leaves us again after 77 days. Who knows what we’re in store for.
Appendix – Who Might Have Gotten The Job?
As an aside, why don’t we look at the recent data for some other managers who may have been appointed had Harris either turned us down or not been contacted.
TalkSport had Wayne Rooney on the list, but I can’t imagine any club in danger of relegation doing their homework would give him a job.

His last two jobs, Birmingham City and Plymouth Argyle, have been very lacklustre. He managed 0.67 PPG at Birmingham and 0.78 at Plymouth and 1.02 at DC United across 1.5 seasons. In my opinion, he’d have secured relegation so I’m happy nothing came of this.
Another possible manager was Paul Warne, who got Derby promoted last season but was sacked at the beginning of this month.
Warne could have been an interesting option, as he is clearly a good at the top end of League One, as he’s shown over multiple stints. It’s certainly difficult to move up to the Championship but no one would have complained had we appointed him instead of Harris - whether that was in any world realistic is another matter, and we’re into a world of conjecture there.
Either way, we’ve got our man back. Strap in, we’re in for quite the ride.
 | A guest post by
|